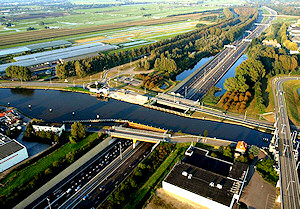
Gouwe Aqueduct - the country's number 1 danger spot
Thursday 26 January 2012 (update Monday 30 January) In 2011, the northbound carriageway of the Gouwe Aqueduct was the most dangerous section of road in the Netherlands. The aqueduct forms part of the A12 left between hectometre markers 27.0 and 28.0. At this point, the A20 motorway to Rotterdam splits off from the A12 motorway to The Hague. In 2011, Stichting Incident Management Nederland dealt with seventy road traffic accidents at this location. The recovery company responsible was Bergings Combinatie Utrecht.
The second most dangerous motorway section is the northbound carriageway of the A20 at Kleinpolderplein. Between hectometre markers 28.0 and 29.0 on the A20 right, 51 accidents were reported to Stichting Incident Management Nederland in 2011. The preceding kilometres (29.0 - 30.0 and 30.0 - 31.0) on this motorway also appear in the top ten most hazardous road sections (see table). The IM recovery company at this location is Berging- en Transportbedrijf A. Barendregt.
A noticeably large number of accidents occurred on the northern carriageway of the A58 motorway at the Oirschot turnoff; number three on the list. At this location, the road narrows from three to two lanes. This situation was created in November 2010, when the section of road between Eindhoven and Oirschot was widened. In particular during the initial period following the opening of the new road, this proved an accident hotspot. Fortunately, the vehicles involved in accidents were able to rely on the competent assistance of Bergingsdienst.nl.
Most dangerous road sections per lane in 2011
| Road | from | to | Accidents | |
|---|---|---|---|---|
| A12 | 27,0 | - | 28,0 L | 70 |
| A20 | 28,0 | - | 29,0 R | 51 |
| A58 | 19,0 | - | 20,0 R | 44 |
| A20 | 29,0 | - | 30,0 R | 42 |
| A2 | 35,0 | - | 36,0 R | 41 |
| A4 | 11,0 | - | 12,0 L | 41 |
| A10 | 14,0 | - | 15,0 L | 40 |
| A2 | 31,0 | - | 32,0 L | 39 |
| A20 | 30,0 | - | 31,0 R | 37 |
| A4 | 70,0 | - | 71,0 L | 36 |
An analysis of the breakdown of road traffic accidents over longer road sections shows that as in previous years, the A10 and A20 motorways once again headed the list in 2011. On the two carriageways of the A10 Amsterdam Orbital, between hectometre marker 10.0 (Zeeburgertunnel) and 30.0 (Coentunnel), a total of 669 accidents were reported. This equates to an average of 16.7 accidents per kilometre per carriageway. During the same period, the national average for all motorways amounted to 2.5 reports per kilometre per carriageway. On the A20, between hectometre markers 20.0 (Vlaardingen-West) and 40.0 (Capelle-Schollevaar), 537 accidents were reported; an average of 13.4 per lane, per kilometre.
The motorway with the least accidents, as has traditionally been the case, was the western carriageway of the road across the Afsluitdijk. At this location, between hectometre marker 60.0 (halfway between Den Oever and Wieringerwerf) and 80.0 (to the west of Breezanddijk), Bergingsbedrijf Kempeneers was called out to attend just thirteen accidents, representing an average of 0.3 incidents per lane per kilometre, for each carriageway.
Most dangerous roads in 2011
| Road | from | to | Accidents/km | |
|---|---|---|---|---|
| A10 | 10,0 | - | 30,0 | 16,7 |
| A20 | 20,0 | - | 40,0 | 13,4 |
| A16 | 10,0 | - | 30,0 | 9,4 |
| A4 | 0,0 | - | 20,0 | 9,1 |
| A4 | 30,0 | - | 50,0 | 8,9 |
| A1 | 0,0 | - | 20,0 | 7,9 |
| A12 | 20,0 | - | 40,0 | 7,7 |
| A15 | 50,0 | - | 70,0 | 6,9 |
| A9 | 30,0 | - | 50,0 | 6,8 |
| A1 | 30,0 | - | 50,0 | 6,6 |
The rankings appearing in this report are based on absolute numbers of accidents per road section. No relationship is made between the number of accidents and the traffic intensity on the road section in question. Accidents reported directly to the emergency services, emergency assistance centres or the Central Truck Reporting Point and not reported to Stichting Incident Management Nederland, are not included in these figures. Road sections made up of multiple carriageways such as motorway intersections and roads with parallel carriageways are listed in the overview as if they had been a single carriageway. As a consequence, at the locations in question, the figures cannot be directly compared with the number at locations where there is indeed just one carriageway.